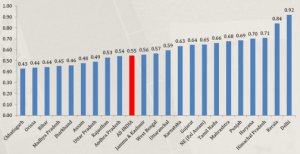
Haryana Human Development Index
Human Development Index (HDI)
The Human Development Index (HDI) is a summary measure of average achievement in key dimensions of human development: a long and healthy life, being knowledgeable and have a decent standard of living. The HDI is the geometric mean of normalized indices for each of the three dimensions.
The index was developed by Mahbub-ul-Haque along with Amartya Sen which is used by the United Nations Development Programme (UNDP) in their annual report since 1990.
Its goal was to place people at the centre of the development process in terms of economic debate, policy and advocacy. This report ranks the countries on the basis of the Human Development Index.
Human Development Index for Indian States have also been calculated depending on the data collected from various sources for Indian states.
It measures the average achievements in a country in three basic dimensions of human development:
- A long and healthy life
- Access to knowledge
- Decent standard of living
Health (A long and healthy life)
The estimates of life expectancy for 16 major states are obtained from SRS Based Abridged Life Tables 2002-2006. The estimates of inequality have also been derived from the SRS Based Abridged Life Tables, which also provides a profile of mortality across age-intervals for the Indian states.
Education (Access to knowledge)
The mean years of schooling of the adult population (aged 25 years and above) are estimated using the NSS data on educational status and training in India. The same data source is used to obtain estimate of Atkinson inequality in levels of education. Estimates of school life expectancy are made based on the NSS unit record data on education in India
Income (Decent standard of living)
The HDI uses the estimate of Gross National Income per capita (PPP US$) for India from the HDR 2010. Per capita income estimates for states are computed using the National Sample Survey (NSS) estimates of per capita personal consumer expenditure for the year 2004-05 assuming that size distribution of income distribution across states is the same as that of NSS consumer expenditure distribution.
HDI used estimates of Atkinson measure of inequality based on the NSS unit record data on per capita consumer expenditure distribution for the year 2004-05 as proxy for corresponding inequality estimate of income.
Human Development Index of the State
Haryana slipped two places down to the ninth spot in 2015 with 2007-08 terms of human development index (HDI) as compared to its seventh position in 1999-2000.
Value of HDI in 2015 was 0.661 and it comes to 9th spot in the country.
Though Haryana’s HDI value improved from 0.501 (1999-2000) to 0.552 (2007-08), the other states performed better during this period.
The paper said that broadly Haryana’s position indicates that state’s expenditure and governance focus needs to be adjusted so as to consistently and rapidly improve its HDI value and its position in the national ranking. This trend contrasts against our ranking in GSDP and PCI.
HDI incorporates the following components and indicators in the state
Standard of living, which refers to control over resources: This component should ideally be measured by per capita consumption expenditure using the data from the NSS (National Sample Survey) Rounds.
Income data at district level are available for only some states in India. In that case, any one of these proxies can be used: (a) per capita output in agriculture and industries together; (b) per capita bank deposits;
and (c) percentage households having specified assets. For district level HDI, per capita bank deposits have been used as an indicator.Access to knowledge or educational attainment: This component is measured in terms of (a) adult literacy rate, and (b) Female literacy rate. These data are available from the population censuses for the states as well as districts of India disaggregated by gender.
Ability to lead a long and healthy life: This component can be measured in terms of: (a) LEB, (b) incidence of disability, and (c) incidence of morbidity (short-term and long-term/chronic). Data for (a) and (b) are available, but that for (c) are not reliable. Data on morbidity are not reliable as the incidence of diseases measured is more dependent on their being reported than on actual incidence. For states where the health infrastructure is good and/or literacy rates are higher, reporting of morbidity is higher. Its use therefore cannot be recommended. LEB remains as an indicator that can be used. But LEB data are not available for districts. Instead, IMR (Infant Mortality Rate), which has a strong positive correlation with LEB, has been used.
Goals for Indices
Fixing the goal-posts for constructing indices at regional levels
is an important exercise. Since our aim is to see the relative Human Development in the districts falling within the Haryana Sub region the goal-posts selected is maximum or minimum values in the series. Four different indicators are used for HDI district level. Hence, for each of these, the goal-posts are separate.The three indicators and their goal-posts are:
- Since district incomes are not available, the indicator used is per capita bank deposits. The goal-posts set are the best performing and the worst performing districts in the sub- region. In 2001, the maximum was Rs. 16,906 in Gurgaon and minimum was Rs. 6787 in Jhajjar district.
- For literacy rate, the maximum value is taken as 75.2% (Rewari) and minimum value is taken as 62.9% (Gurgaon). For Female literacy, the maximum is taken as 62.6% (Rhotak) and minimum is taken as 47.8% (Gurgaon)
- For Infant Mortality rate, the worst is taken as 77 (Faridabad) and best is taken as 26 (Sonipat).
- HPSC Mains Tests and Notes Program 2025
- HPSC Prelims Exam 2025- Test Series and Notes Program
- HPSC Prelims and Mains Tests Series and Notes Program 2025
- HPSC Detailed Complete Prelims Notes 2025
